Analytics

Our Analytics Suite provides 360-degree visibility into content perfomance and user experience.
Benefits
Features
RT Stats
Four distinct reporting modules enable intelligent segmentation best suited to your analytics needs:
Download the JoDiHost Real-Time Stats app today in the iTunes Store for iOS devices or in the Google Play store for Android devices.
Try our features with a no commitment test account
ANALYTICS DETAILS
The reports in our EC360 Analytics Suite can be used in traffic activity, bandwidth usage, storage usage, and cash activity statistics. These reports provide our customers with the info on how CDN is delivering data to their users and help the customers to analyze data usage patterns.
The example of Analytics Tab is:
In general, EC360 Analytics Suite consists of the following modules:
In order to view a report the customer must simply navigate the needed reporting module (i.e., Core Reporting, Advanced Content Analytics, Real-Time Statistics, or Edge Performance Analytics) and then click on the needed report. The reports, except Real-Time Statistics, can be filtered by POP and/or time period. Real-Time Statistics always display current info on CDN activity of the customer’s account.
Several reports (e.g., Traffic Summary, Bandwidth, Data Transferred) provide information on the CDN response to the client.
The customers are offered the following HTTP Streaming Solutions: HTTP Progressive Download, HTTP Live Streaming, HTTP Dynamic Streaming, and Smooth Streaming. The customers may also get traffic statistics for all of those HTTP Streaming solutions in reports that are generated for the HTTP Large Platform.
Core Reporting Module
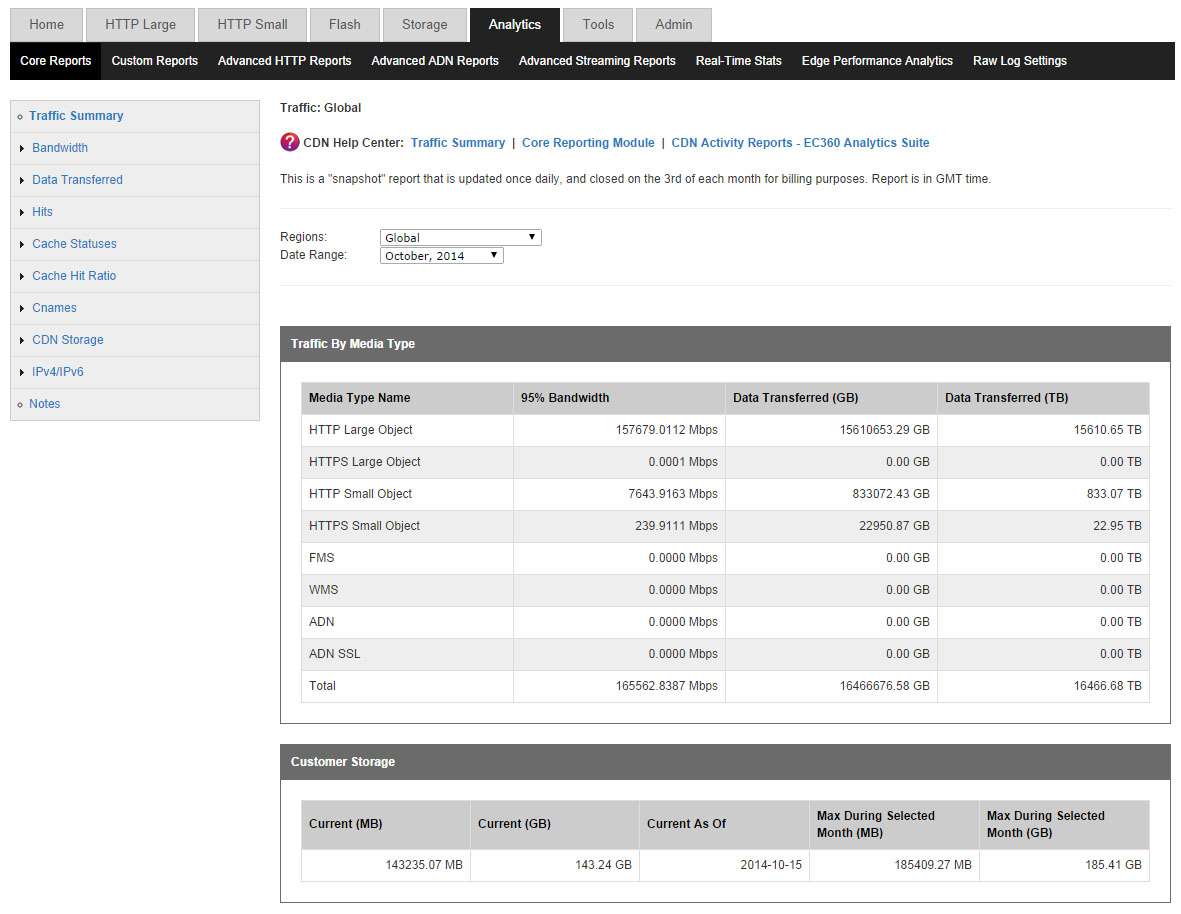
The Traffic Summary report provides data on how much of the customer’s traffic is being routed through the CDN for each platform.
When viewing traffic data, the customer can choose to view all traffic or only the traffic that is routed to a particular region.
Example:

The customer is also allowed to view bandwidth (Mbps) usage by platform and protocol. This report is based on traffic statistics tracked by our edge servers.
Example:
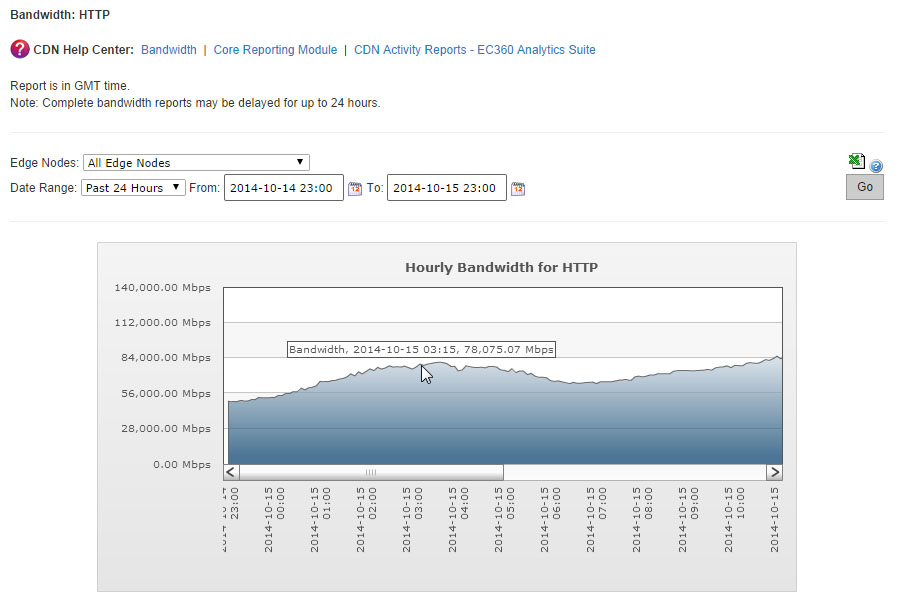
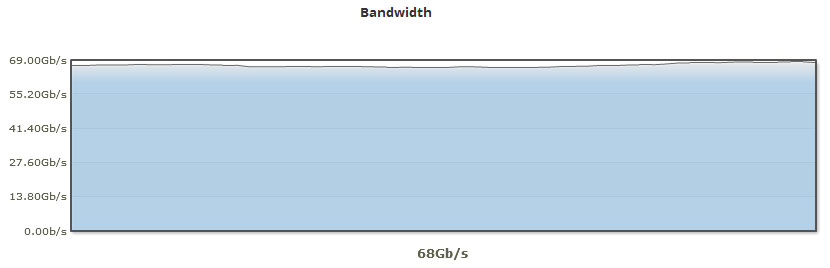
A Bandwidth report consists of a graph indicating the bandwidth usage for the selected platform, protocol, and/or POP(s) over a particular time period.
The customer is also allowed to view the amount of data transferred (MB). This report is based on traffic statistics tracked by our edge servers.
Example:
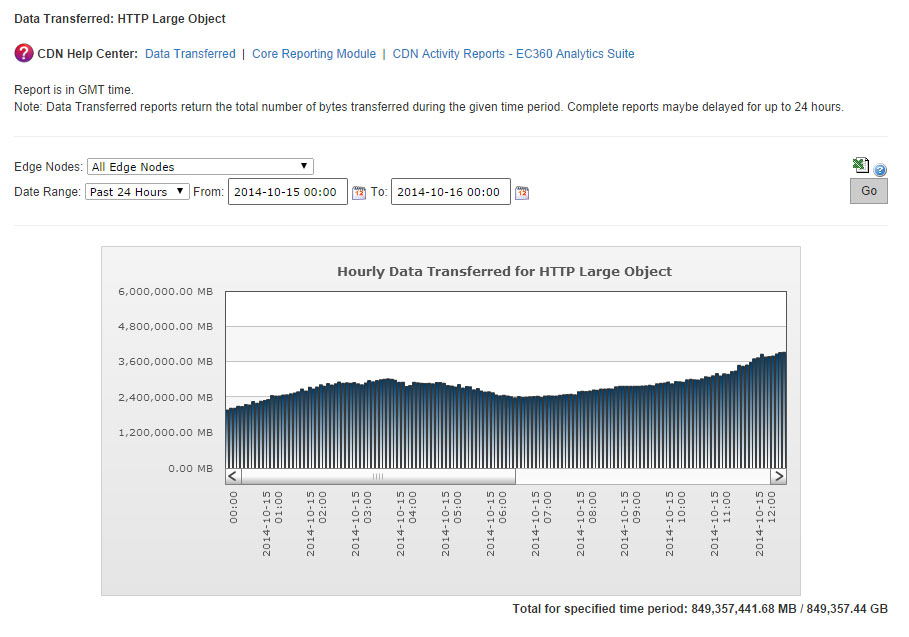
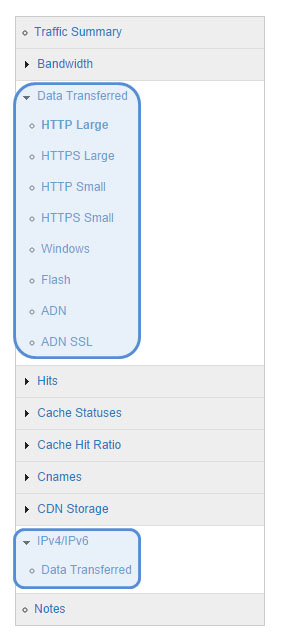
A Data Transferred report can report data based on platform/protocol or by the type of IP address (i.e., IPv4 or IPv6) used by users to request the customer’s content. The manner in which data is organized for this type of report is determined by the customer’s selection in the side navigation bar.
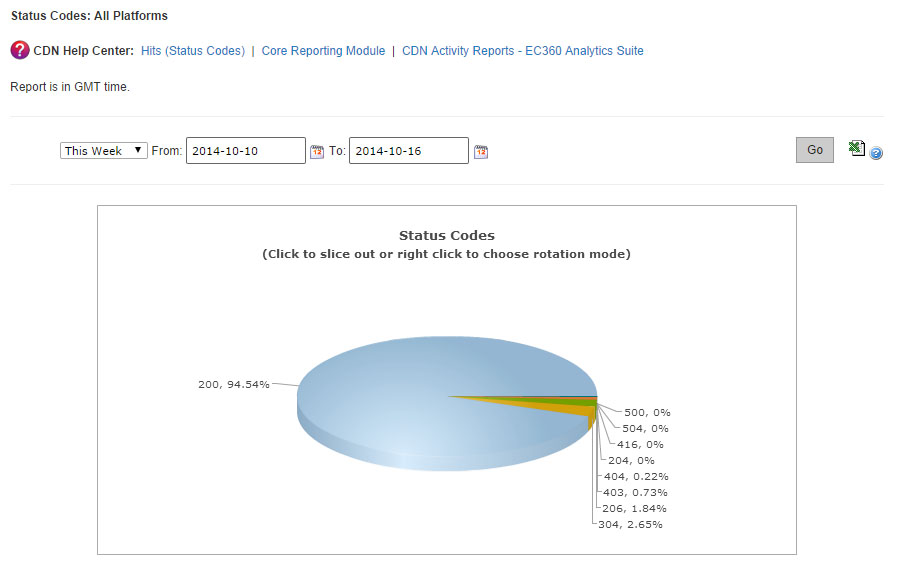
The Hits report allows the customer to view the frequency of each status code as a percentage of total requests. This report is based on traffic statistics tracked by our edge servers.
Example:
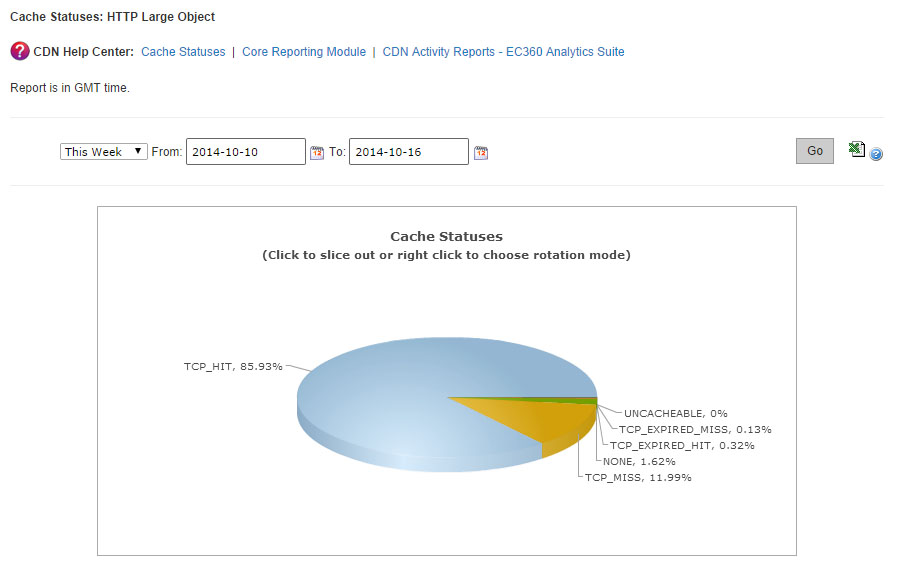
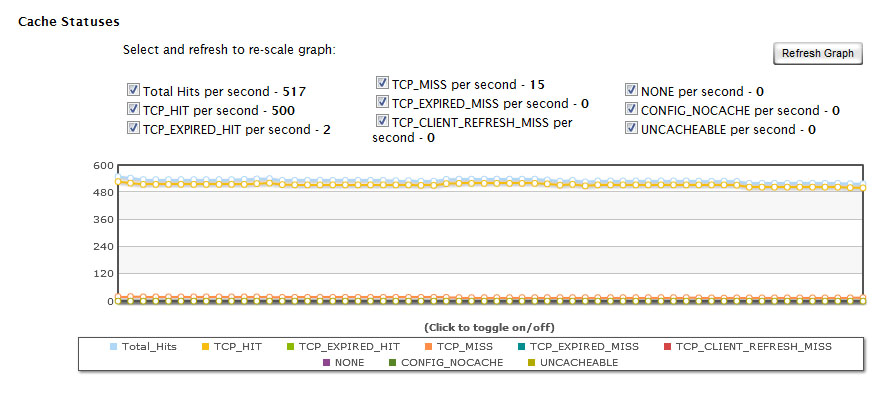
The Cache Statuses report gives a detailed breakdown of cache behavior, which may reveal approaches for improving the overall end-user experience. Since the fastest performance comes from cache hits, the customer can optimize data delivery speeds by minimizing cache misses and expired cache hits.
Example:
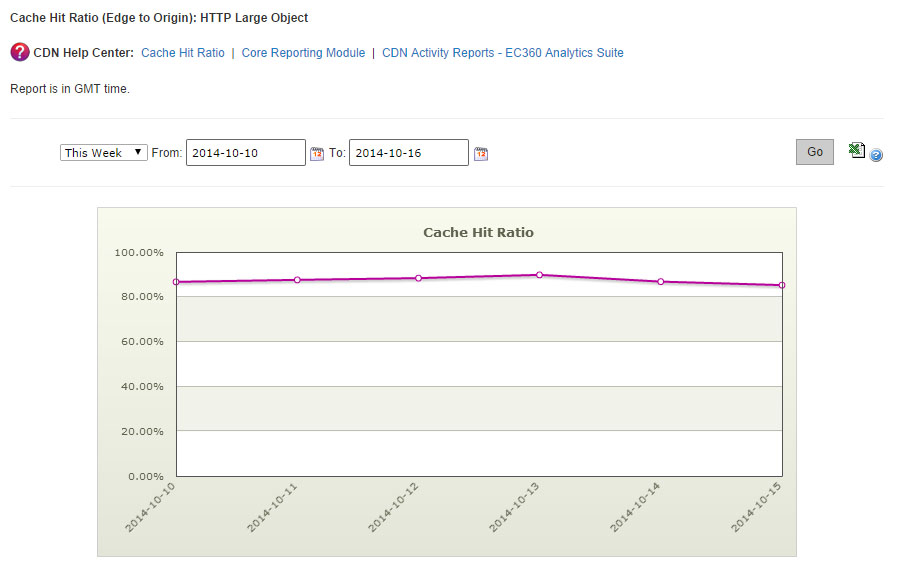
Another report, that is given to the customer, is Cache Hit Ratio report. It indicates the percentage of cacheable requests that were served directly from cache to the requester.
The Cnames report provides data transferred statistics for each edge CNAME.
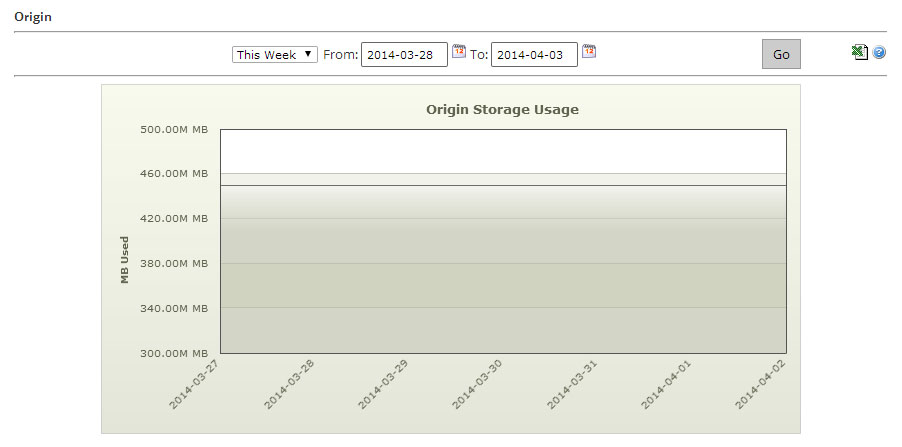
The CDN Storage Usage report provides daily statistics on CDN storage usage.
The Route Summary Query Count report indicates the total number of DNS queries that were resolved by our Route name servers for each of the customer’s fully managed and secondary zones. It also indicates the total number of DNS requests that were resolved for all of the customer’s zones.
By using the Custom Reports module the customer is also allowed to define the type of requests for which data will be collected. This process requires the activation of the Custom Reports capability, which allows our edge servers to keep track of the number of hits and the amount of data transferred for all requests that match the specified request criteria.
Advanced Content Analytics
The reports that is provided in the Advanced Content Analytics module allow the customers to probe a little bit deeper into where their content is being requested and what happens after it gets requested.
In the Advanced HTTP/ADN/Streaming Reports section the customers are provided with detailed information on CDN activity for the HTTP Large, ADN, Flash Media Streaming, and the Windows Media Streaming platforms.
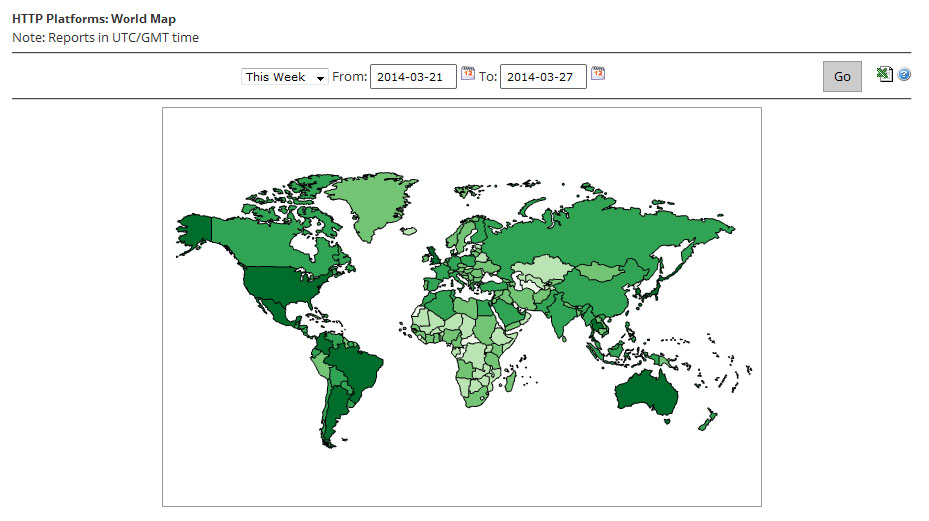
The next section provides Geography Reports (Map-Based).
There are five reports that take advantage of a map to indicate the regions from which the customer’s content is being requested. These reports are World Map, United States Map, Canada Map, Europe Map, and Asia Pacific Map. Each map-based report ranks geographic entities (i.e., countries, states, and provinces) according to the percentage of hits that originated from that region.
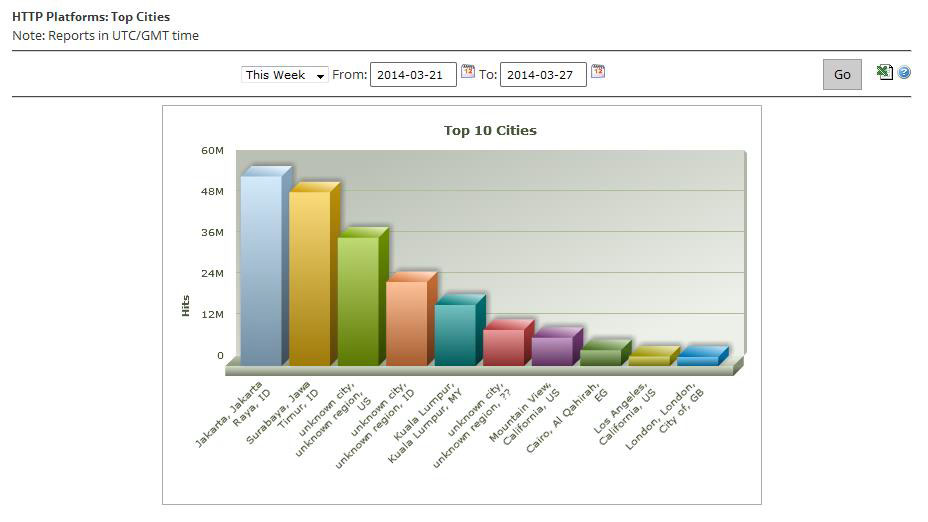
There are two additional reports that provide statistical information according to geography, which are Top Cities and Top Countries. These reports rank cities and countries, respectively, according to the number of hits that originated from those regions. Upon generating this type of report, a bar chart will indicate the top 10 cities or countries that requested content over the HTTP Large, ADN, Flash Media Streaming, or the Windows Media Streaming platform.
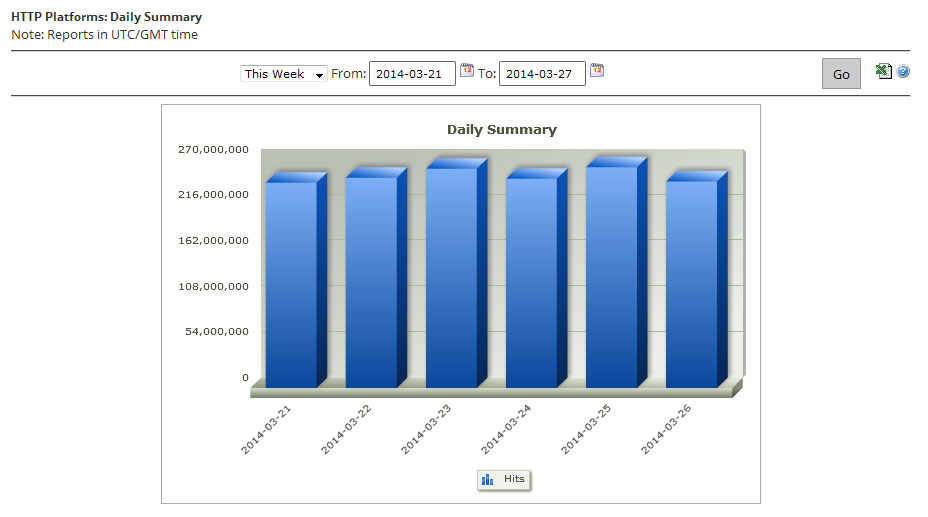
The Daily Summary report allows the customers to view the total number of hits and data transferred over the HTTP Large, ADN, Flash Media Streaming, or the Windows Media Streaming platform on a daily basis. This information can be used to quickly discern CDN activity patterns. For example, this report can help the customers detect which days experienced higher or lower than expected traffic.
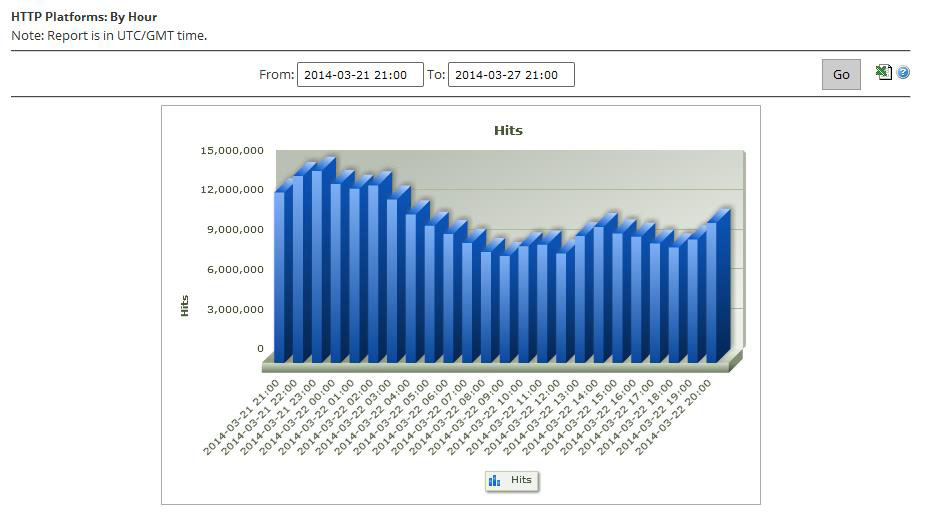
The By Hour report allows the customers to view the total number of hits and data transferred over the HTTP Large, Flash Media Streaming, or the Windows Media Streaming platform on an hourly basis. This report can help them detect the time periods during the day that experience higher or lower than expected traffic.
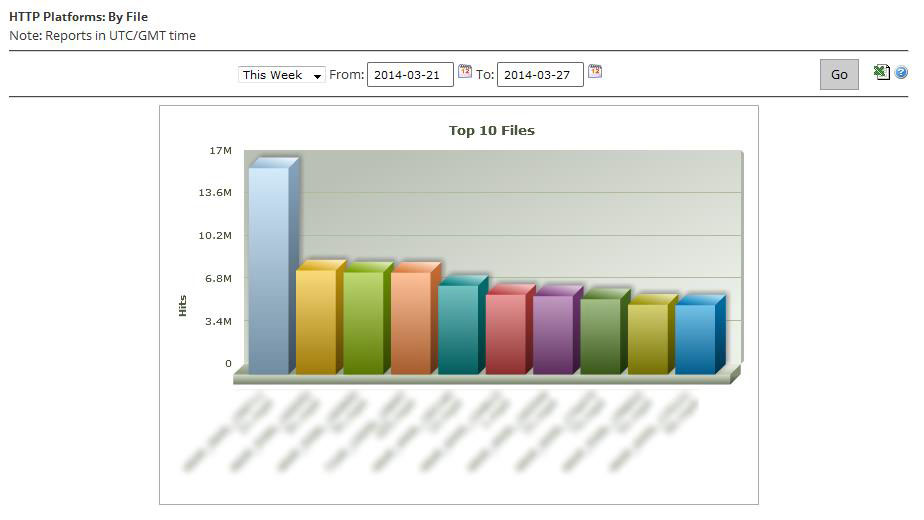
The By File report allows the customers to view the amount of demand and the traffic incurred over the HTTP Large, ADN, Flash Media Streaming, or the Windows Media Streaming platform for the most requested assets. Upon generating this type of report, a bar chart will be generated on the top 10 most requested assets over the specified time period.
The customers also can get by File Detail, by File Type, by Directory, by Browser, by Referrer, by Download and by 404 Errors advanced reports.
CDN activity data must be collected by the Advanced Content Analytics module before it can generate reports on it. This collection process occurs once a day and it covers the activity that took place during the previous day.
Real-Time Statistics provides real-time data about the performance of the CDN when delivering content to the customer’s clients. When viewing real-time statistics, the customer can choose to either view a statistical overview for all platforms or he can view more detailed information on a particular platform.
The Overview report provides a single dashboard from which the customer can view real-time bandwidth and traffic data for all available platforms. Additionally, he can view the number of purge and load requests that are still in queue and the current amount of CDN storage space in use.
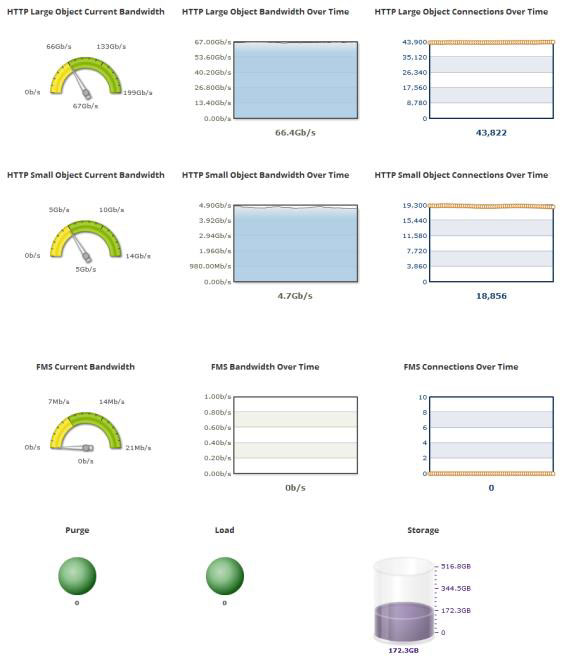
The following graphs are available when viewing real-time statistics for the HTTP-based platforms:
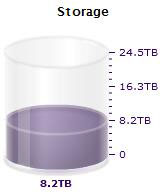
The Other Stats report provides information over how many purge/load requests are currently being processed and the amount of CDN storage space being used.
Edge Performance Analytics
Edge Performance Analytics provides granular information on the amount of traffic and bandwidth for the HTTP Large, HTTP Small, and ADN platforms. This information can be used to generate trending statistics, which allow the customers to gain insight on how their assets are being cached and delivered to their clients. It allows the customers to form a strategy on how to optimize the delivery of their content and to determine what issues should be tackled to better leverage the CDN. As a result, not only will the customers be able to improve data delivery performance, but they will also be able to reduce their CDN cost structure.
CDN activity data must be collected by the Edge Performance Analytics module before it can generate reports on it. This collection process occurs once a day and it covers the activity that took place during the previous day.
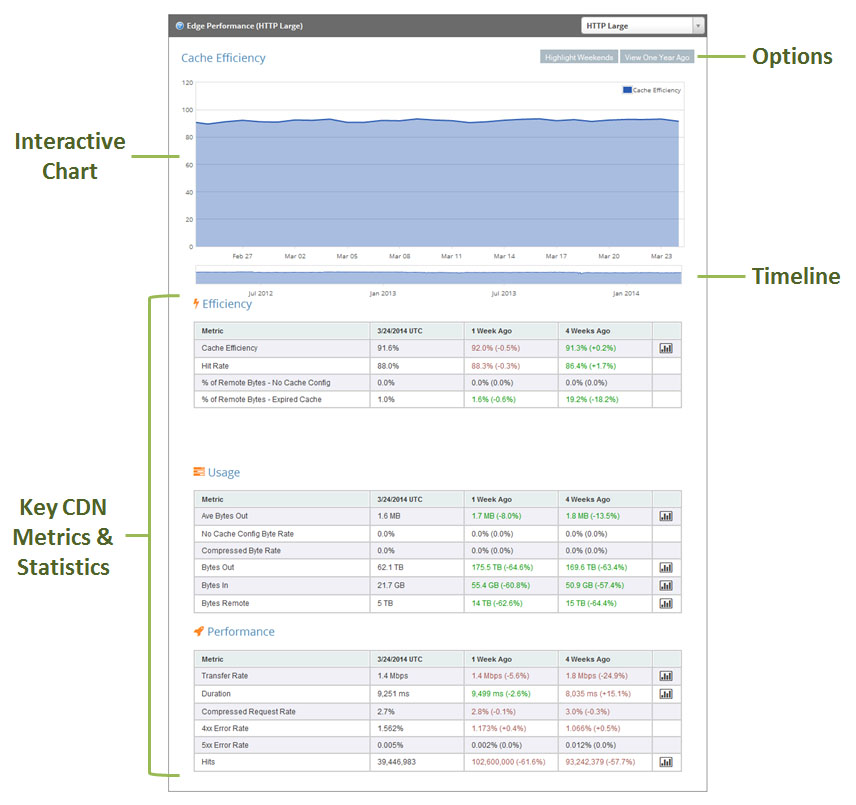
The Edge Performance Analytics dashboard tracks current and historical CDN traffic through a chart and statistics. The customers use this dashboard to detect recent and long-term trends on the performance of CDN traffic for their accounts.
Automated e-mail delivery of Edge Performance Analytics reports may be scheduled and allows quick and consistent review of CDN activity without requiring manual report generation.
In addition to receiving reports through e-mail, the customers may also be alerted as to when a particular condition arises. This allows the customers to catch problems quicker and therefore solve them sooner.
With Edge Performance Analytics the customers are provided with Daily Summary and Hourly Summary reports that allow them traffic trends over a specified time period.
Also the customers are provided with Protocols report that displays the breakdown of traffic between the HTTP and HTTPS protocols. A donut chart indicates the percentage of hits that occurred for each type of protocol.
The URLs report contains a graph that displays the top 10 requested URLs.
The CNAMEs report contains a graph that displays the top 10 CNAMEs used to request assets over the time span of a report.
The Origins report contains a graph that displays the top 10 CDN or customer origin servers from which assets were requested over a specified period of time.
The Geo POPs report shows how much of your traffic is being routed through a particular point-of-presence (POP).
The Clients report contains a graph that displays the top 10 clients that requested assets over a specified period of time.
The Cache Statuses report gives a detailed breakdown of cache behavior, which may reveal approaches for improving the overall end-user experience. Since the fastest performance comes from cache hits, the customers can optimize data delivery speeds by minimizing cache misses and expired cache hits.
The NONE Details report contains a graph that displays the top 10 URLs for assets for which cache content freshness was not checked over a specified period of time.
The UNCACHEABLE Details report contains a graph that displays the top 10 URLs for assets that could not be cached due to request header data.
The TCP_HIT Details report contains a graph that displays the top 10 URLs for assets that are served immediately from cache.
The TCP_MISS Details report contains a graph that displays the top 10 URLs for assets that have a cache status of TCP_MISS.
The TCP_EXPIRED_HIT Details report contains a graph that displays the top 10 URLs for stale assets that were served directly from the POP.
The TCP_EXPIRED_MISS Details report contains a graph that displays the top 10 URLs for stale assets for which a new version had to be retrieved from the origin server.
The TCP_CLIENT_REFRESH_MISS Details report contains a bar chart that displays the top 10 URLs for assets were retrieved from an origin server due to a no-cache request from the client.
The Client Request Types report indicates the type of requests that were made by HTTP clients (e.g., browsers). This report includes a donut chart that provides a sense as to how requests are being handled.
The User Agent report contains a bar graph displaying the top 10 user agents to request your content through our CDN. Typically, a user agent is a web browser, media player, or a mobile phone browser.
The Referrers report contains a bar graph displaying the top 10 referrers to content accessed through our CDN.
The Compression Types report contains a donut chart that breaks down requested assets by whether they were compressed by our edge servers.
Except these reports, the customers are also provided with File Types and Unique Files reports.
And one more important report is Token Auth Summary report that contains a pie chart that provides a quick overview on whether requested assets were protected by Token-Based Authentication.
The Token Auth Deny Details report contains a bar graph that allows the customer to view the top 10 requests that were denied due to Token-Based Authentication.
The HTTP Response Codes report provides a breakdown of the HTTP status codes (e.g., 200 OK, 403 Forbidden, 404 Not Found, etc.) that were delivered to your HTTP clients by our edge servers.
There are also Real-time alerts that were designed to provide the customers with real-time notification as to current trends in the network traffic for their accounts.
There are two types of actions that can take place when a specified condition has been met, which are e-mail notifications or posting data to an external server. E-mail notifications allow the customer to stay on top of CDN account activity without having to monitor real-time statistics for the desired platform. HTTP (POST) notifications allow the customer to leverage a web server to transform data provided by our network monitoring system.
Example of an Alert created:
The example of Analytics Tab is:
In general, EC360 Analytics Suite consists of the following modules:
| Module | Purchase Separately? | Data Availability | Update Frequency |
| Core Reporting | No | 18 months | Continuous |
| Custom Reports | No | 18 months | Continuous |
| Advanced Content Analytics | Yes | 90 days | Daily (Previous Day) |
| Real-Time Statistics | Yes | Real-Time | Real-Time |
| Edge Performance Analytics | Yes | 90 days | Daily (Previous Day) |
In order to view a report the customer must simply navigate the needed reporting module (i.e., Core Reporting, Advanced Content Analytics, Real-Time Statistics, or Edge Performance Analytics) and then click on the needed report. The reports, except Real-Time Statistics, can be filtered by POP and/or time period. Real-Time Statistics always display current info on CDN activity of the customer’s account.
Several reports (e.g., Traffic Summary, Bandwidth, Data Transferred) provide information on the CDN response to the client.
The customers are offered the following HTTP Streaming Solutions: HTTP Progressive Download, HTTP Live Streaming, HTTP Dynamic Streaming, and Smooth Streaming. The customers may also get traffic statistics for all of those HTTP Streaming solutions in reports that are generated for the HTTP Large Platform.
Core Reporting Module
The Traffic Summary report provides data on how much of the customer’s traffic is being routed through the CDN for each platform.
When viewing traffic data, the customer can choose to view all traffic or only the traffic that is routed to a particular region.
Example:
The customer is also allowed to view bandwidth (Mbps) usage by platform and protocol. This report is based on traffic statistics tracked by our edge servers.
Example:
A Bandwidth report consists of a graph indicating the bandwidth usage for the selected platform, protocol, and/or POP(s) over a particular time period.
The customer is also allowed to view the amount of data transferred (MB). This report is based on traffic statistics tracked by our edge servers.
Example:
A Data Transferred report can report data based on platform/protocol or by the type of IP address (i.e., IPv4 or IPv6) used by users to request the customer’s content. The manner in which data is organized for this type of report is determined by the customer’s selection in the side navigation bar.
The Hits report allows the customer to view the frequency of each status code as a percentage of total requests. This report is based on traffic statistics tracked by our edge servers.
Example:
The Cache Statuses report gives a detailed breakdown of cache behavior, which may reveal approaches for improving the overall end-user experience. Since the fastest performance comes from cache hits, the customer can optimize data delivery speeds by minimizing cache misses and expired cache hits.
Example:
Another report, that is given to the customer, is Cache Hit Ratio report. It indicates the percentage of cacheable requests that were served directly from cache to the requester.
The Cnames report provides data transferred statistics for each edge CNAME.
The CDN Storage Usage report provides daily statistics on CDN storage usage.
The Route Summary Query Count report indicates the total number of DNS queries that were resolved by our Route name servers for each of the customer’s fully managed and secondary zones. It also indicates the total number of DNS requests that were resolved for all of the customer’s zones.
By using the Custom Reports module the customer is also allowed to define the type of requests for which data will be collected. This process requires the activation of the Custom Reports capability, which allows our edge servers to keep track of the number of hits and the amount of data transferred for all requests that match the specified request criteria.
Advanced Content Analytics
The reports that is provided in the Advanced Content Analytics module allow the customers to probe a little bit deeper into where their content is being requested and what happens after it gets requested.
In the Advanced HTTP/ADN/Streaming Reports section the customers are provided with detailed information on CDN activity for the HTTP Large, ADN, Flash Media Streaming, and the Windows Media Streaming platforms.
The next section provides Geography Reports (Map-Based).
There are five reports that take advantage of a map to indicate the regions from which the customer’s content is being requested. These reports are World Map, United States Map, Canada Map, Europe Map, and Asia Pacific Map. Each map-based report ranks geographic entities (i.e., countries, states, and provinces) according to the percentage of hits that originated from that region.
There are two additional reports that provide statistical information according to geography, which are Top Cities and Top Countries. These reports rank cities and countries, respectively, according to the number of hits that originated from those regions. Upon generating this type of report, a bar chart will indicate the top 10 cities or countries that requested content over the HTTP Large, ADN, Flash Media Streaming, or the Windows Media Streaming platform.
The Daily Summary report allows the customers to view the total number of hits and data transferred over the HTTP Large, ADN, Flash Media Streaming, or the Windows Media Streaming platform on a daily basis. This information can be used to quickly discern CDN activity patterns. For example, this report can help the customers detect which days experienced higher or lower than expected traffic.
The By Hour report allows the customers to view the total number of hits and data transferred over the HTTP Large, Flash Media Streaming, or the Windows Media Streaming platform on an hourly basis. This report can help them detect the time periods during the day that experience higher or lower than expected traffic.
The By File report allows the customers to view the amount of demand and the traffic incurred over the HTTP Large, ADN, Flash Media Streaming, or the Windows Media Streaming platform for the most requested assets. Upon generating this type of report, a bar chart will be generated on the top 10 most requested assets over the specified time period.
The customers also can get by File Detail, by File Type, by Directory, by Browser, by Referrer, by Download and by 404 Errors advanced reports.
CDN activity data must be collected by the Advanced Content Analytics module before it can generate reports on it. This collection process occurs once a day and it covers the activity that took place during the previous day.
Real-Time Statistics provides real-time data about the performance of the CDN when delivering content to the customer’s clients. When viewing real-time statistics, the customer can choose to either view a statistical overview for all platforms or he can view more detailed information on a particular platform.
The Overview report provides a single dashboard from which the customer can view real-time bandwidth and traffic data for all available platforms. Additionally, he can view the number of purge and load requests that are still in queue and the current amount of CDN storage space in use.
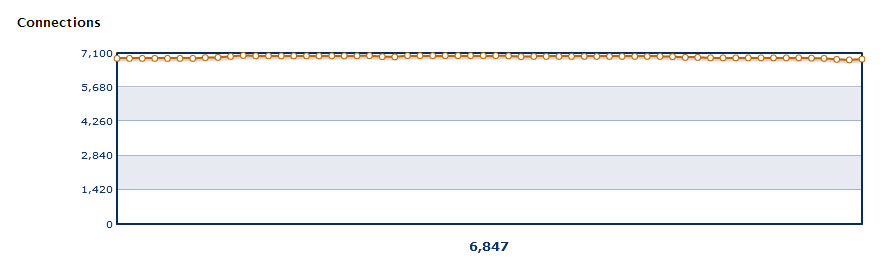
The following graphs are available when viewing real-time statistics for the HTTP-based platforms:
- Bandwidth
- Status Codes
- Cache Statuses
- Connections
The Other Stats report provides information over how many purge/load requests are currently being processed and the amount of CDN storage space being used.
Edge Performance Analytics
Edge Performance Analytics provides granular information on the amount of traffic and bandwidth for the HTTP Large, HTTP Small, and ADN platforms. This information can be used to generate trending statistics, which allow the customers to gain insight on how their assets are being cached and delivered to their clients. It allows the customers to form a strategy on how to optimize the delivery of their content and to determine what issues should be tackled to better leverage the CDN. As a result, not only will the customers be able to improve data delivery performance, but they will also be able to reduce their CDN cost structure.
CDN activity data must be collected by the Edge Performance Analytics module before it can generate reports on it. This collection process occurs once a day and it covers the activity that took place during the previous day.
The Edge Performance Analytics dashboard tracks current and historical CDN traffic through a chart and statistics. The customers use this dashboard to detect recent and long-term trends on the performance of CDN traffic for their accounts.
Automated e-mail delivery of Edge Performance Analytics reports may be scheduled and allows quick and consistent review of CDN activity without requiring manual report generation.
In addition to receiving reports through e-mail, the customers may also be alerted as to when a particular condition arises. This allows the customers to catch problems quicker and therefore solve them sooner.
With Edge Performance Analytics the customers are provided with Daily Summary and Hourly Summary reports that allow them traffic trends over a specified time period.
Also the customers are provided with Protocols report that displays the breakdown of traffic between the HTTP and HTTPS protocols. A donut chart indicates the percentage of hits that occurred for each type of protocol.
The URLs report contains a graph that displays the top 10 requested URLs.
The CNAMEs report contains a graph that displays the top 10 CNAMEs used to request assets over the time span of a report.
The Origins report contains a graph that displays the top 10 CDN or customer origin servers from which assets were requested over a specified period of time.
The Geo POPs report shows how much of your traffic is being routed through a particular point-of-presence (POP).
The Clients report contains a graph that displays the top 10 clients that requested assets over a specified period of time.
The Cache Statuses report gives a detailed breakdown of cache behavior, which may reveal approaches for improving the overall end-user experience. Since the fastest performance comes from cache hits, the customers can optimize data delivery speeds by minimizing cache misses and expired cache hits.
The NONE Details report contains a graph that displays the top 10 URLs for assets for which cache content freshness was not checked over a specified period of time.
The UNCACHEABLE Details report contains a graph that displays the top 10 URLs for assets that could not be cached due to request header data.
The TCP_HIT Details report contains a graph that displays the top 10 URLs for assets that are served immediately from cache.
The TCP_MISS Details report contains a graph that displays the top 10 URLs for assets that have a cache status of TCP_MISS.
The TCP_EXPIRED_HIT Details report contains a graph that displays the top 10 URLs for stale assets that were served directly from the POP.
The TCP_EXPIRED_MISS Details report contains a graph that displays the top 10 URLs for stale assets for which a new version had to be retrieved from the origin server.
The TCP_CLIENT_REFRESH_MISS Details report contains a bar chart that displays the top 10 URLs for assets were retrieved from an origin server due to a no-cache request from the client.
The Client Request Types report indicates the type of requests that were made by HTTP clients (e.g., browsers). This report includes a donut chart that provides a sense as to how requests are being handled.
The User Agent report contains a bar graph displaying the top 10 user agents to request your content through our CDN. Typically, a user agent is a web browser, media player, or a mobile phone browser.
The Referrers report contains a bar graph displaying the top 10 referrers to content accessed through our CDN.
The Compression Types report contains a donut chart that breaks down requested assets by whether they were compressed by our edge servers.
Except these reports, the customers are also provided with File Types and Unique Files reports.
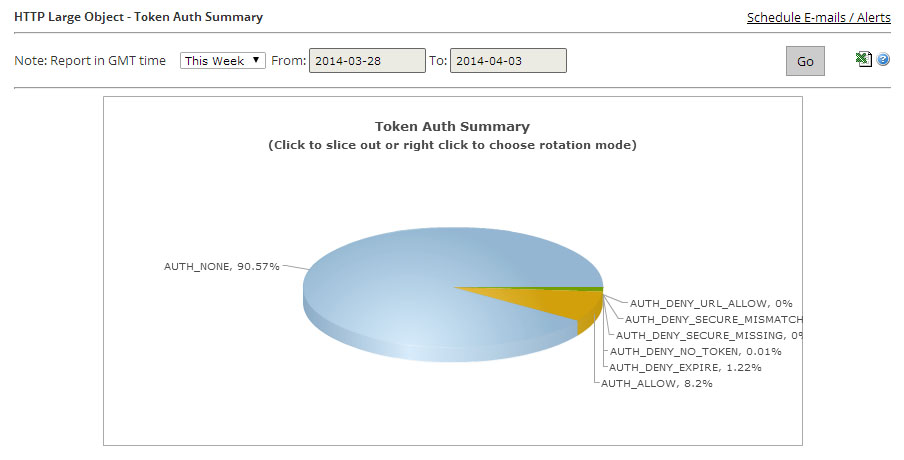
And one more important report is Token Auth Summary report that contains a pie chart that provides a quick overview on whether requested assets were protected by Token-Based Authentication.
The Token Auth Deny Details report contains a bar graph that allows the customer to view the top 10 requests that were denied due to Token-Based Authentication.
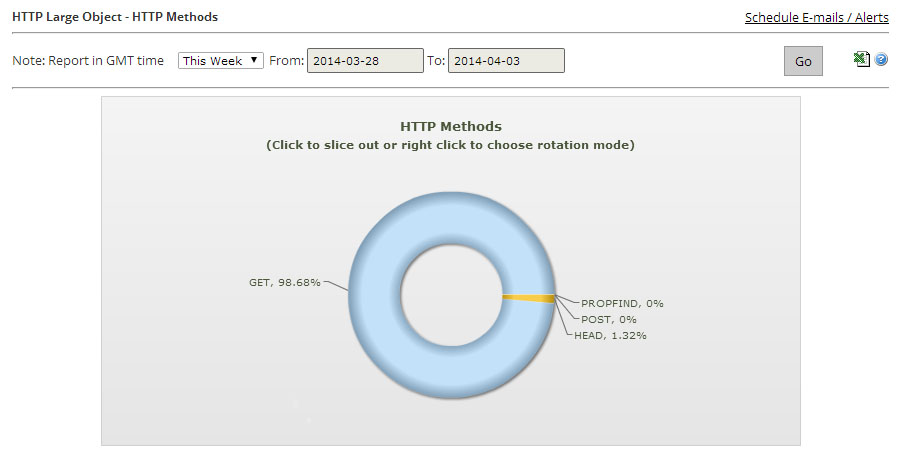
The HTTP Response Codes report provides a breakdown of the HTTP status codes (e.g., 200 OK, 403 Forbidden, 404 Not Found, etc.) that were delivered to your HTTP clients by our edge servers.
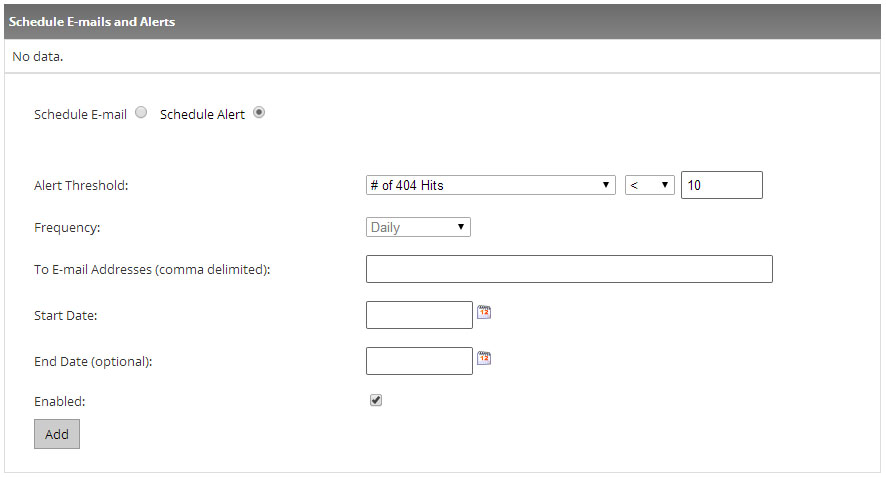
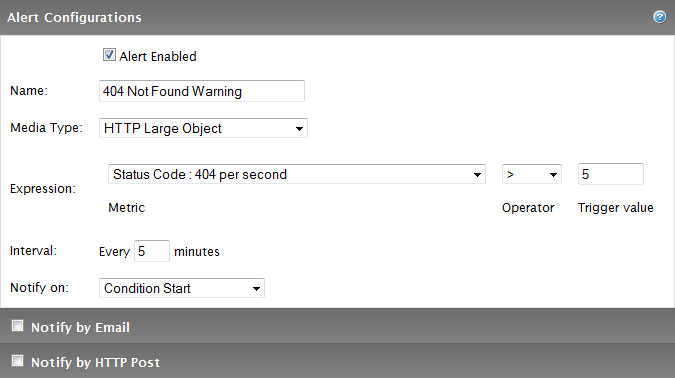
There are also Real-time alerts that were designed to provide the customers with real-time notification as to current trends in the network traffic for their accounts.
There are two types of actions that can take place when a specified condition has been met, which are e-mail notifications or posting data to an external server. E-mail notifications allow the customer to stay on top of CDN account activity without having to monitor real-time statistics for the desired platform. HTTP (POST) notifications allow the customer to leverage a web server to transform data provided by our network monitoring system.
Example of an Alert created:
Try our features with a no commitment test account
OTHER SERVICES
Application Delivery
Accelerate delivery of web applications and non-static content.
Caching
Our delivery and acceleration services will lead you to the world's digital threshold, from complete websites to mobile.
Analytics
Full and instant visibility into performance of the content and the user experience.
Download Manager
Your files are delivered globally with super-fast speed, intelligence and flexibility.
Security
Protect your applications and content from unauthorized use with the powerful security tools.
Edge Optimizer
Powered by Google PageSpeed, Edge Optimizer keeps your application's data and logic off of your network.
Streaming
We will deliver better than anyone else your Flash, Silverlight, or HTTP – live or on-demand.
Storage
It is more than just CDN storage. Security, replication, and caching infrastructures really mean massive scale at ultra-fast rates of speed.
Rules Engine
With our powerful tool you have the whole control over when, how and if the content is served and delivered.
Piranha Purge
Better caching flexibility, efficiency, and performance with Piranha Purge.